Real Numbers
Results from our roster.
A snapshot from creators currently on our chatting team. Numbers are pulled directly from the platform dashboards. Names redacted, watermarked for verification.
Every chart below is from a real client account managed by Z Operation. No mock data, no fabricated numbers. Identifying details have been removed to protect creator privacy. References available on request.
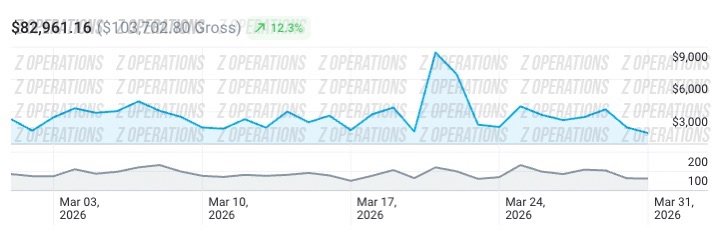
$82,961.16 ($103,702.80 Gross)
Revenue
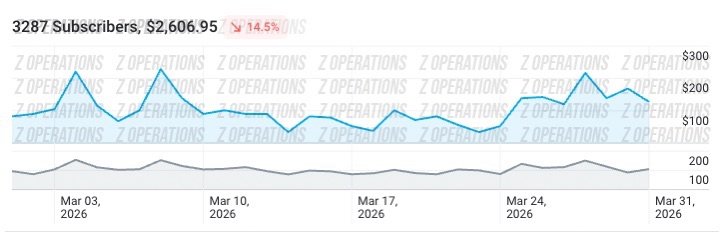
Subscribers
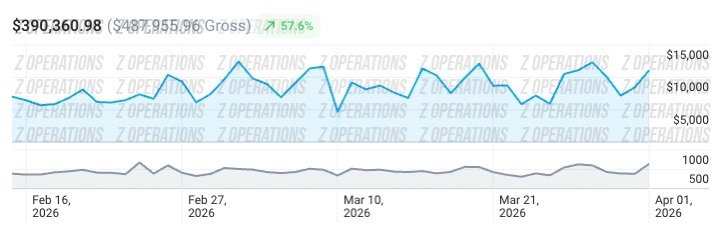
$390,360.98 ($487,955.96 Gross)
Revenue
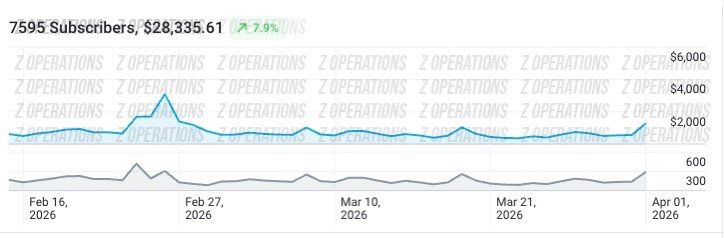
Subscribers
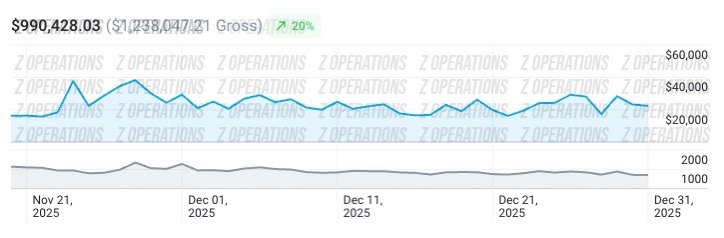
$990,428.03 ($1,238,047.21 Gross)
Revenue
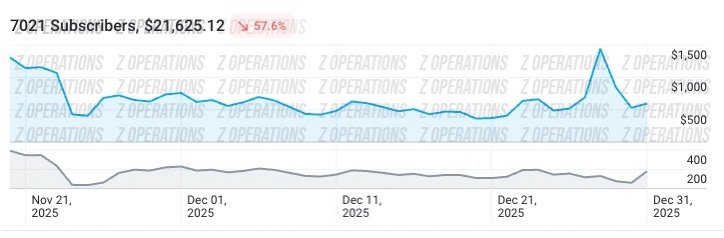
Subscribers
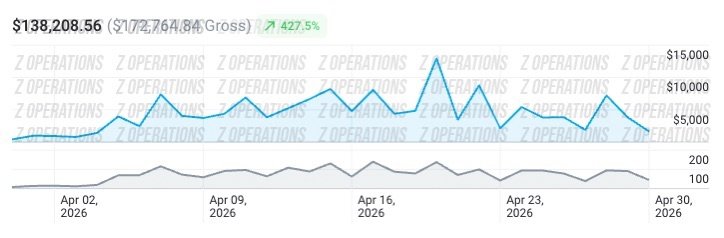
$138,208.56 ($172,764.84 Gross)
Revenue
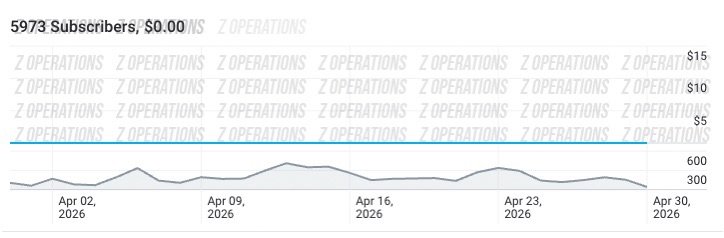
Subscribers
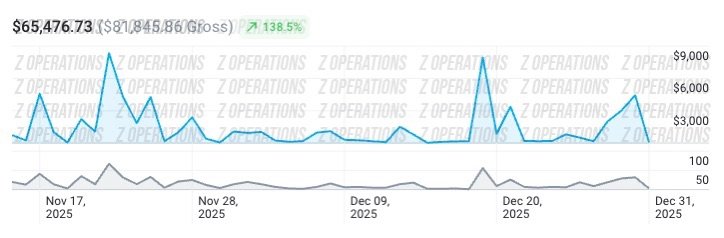
$65,476.73 ($81,845.86 Gross)
Revenue
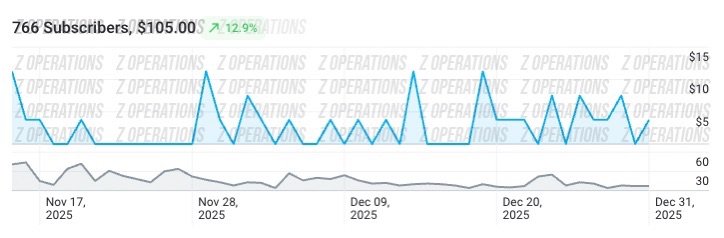
Subscribers
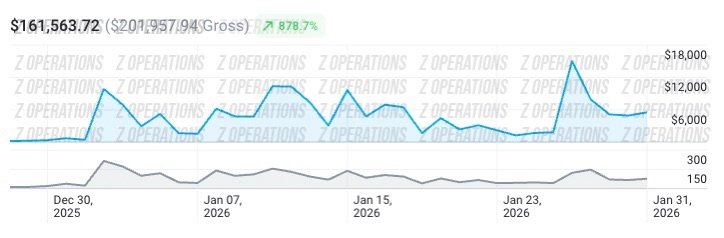
$161,563.72 ($201,957.94 Gross)
Revenue
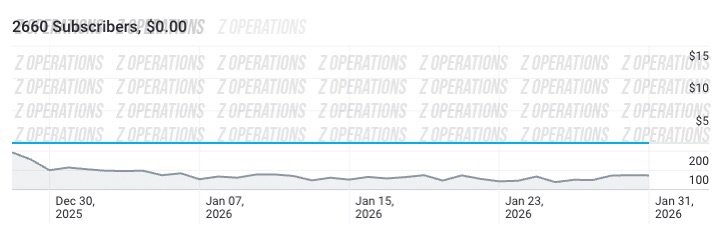
Subscribers
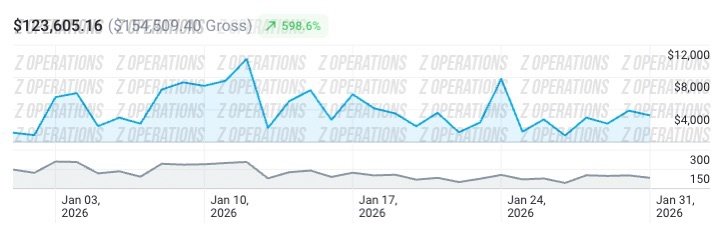
$123,605.16 ($154,509.40 Gross)
Revenue
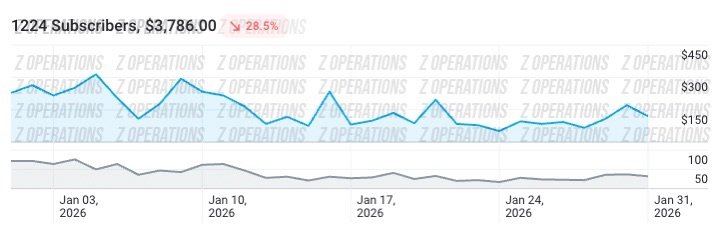
Subscribers
Want results like this?
Apply now. We'll see if you fit, and if you do, we'll get to work.
Apply now